Turning fragmented carrier data into a trusted delivery platform.
An end-to-end transportation analytics solution that ingests carrier reports, standardizes inconsistent shipment data, stores trusted records in Azure, upserts a curated dimensional model in Azure SQL, and delivers delivery-precision insights through Power BI.
One transportation process. Many incompatible data formats.
Every carrier reports shipments differently: column names, date formats, service levels, postal codes, delay codes, commitment rules and file structures all vary. That inconsistency makes a single delivery-precision definition hard to maintain downstream.
The project solves that problem upstream. Carrier-specific complexity is absorbed once in the data platform, producing a reusable shipment model that analytics can trust without rebuilding business rules report by report.
A traceable pipeline from carrier email to analytics.
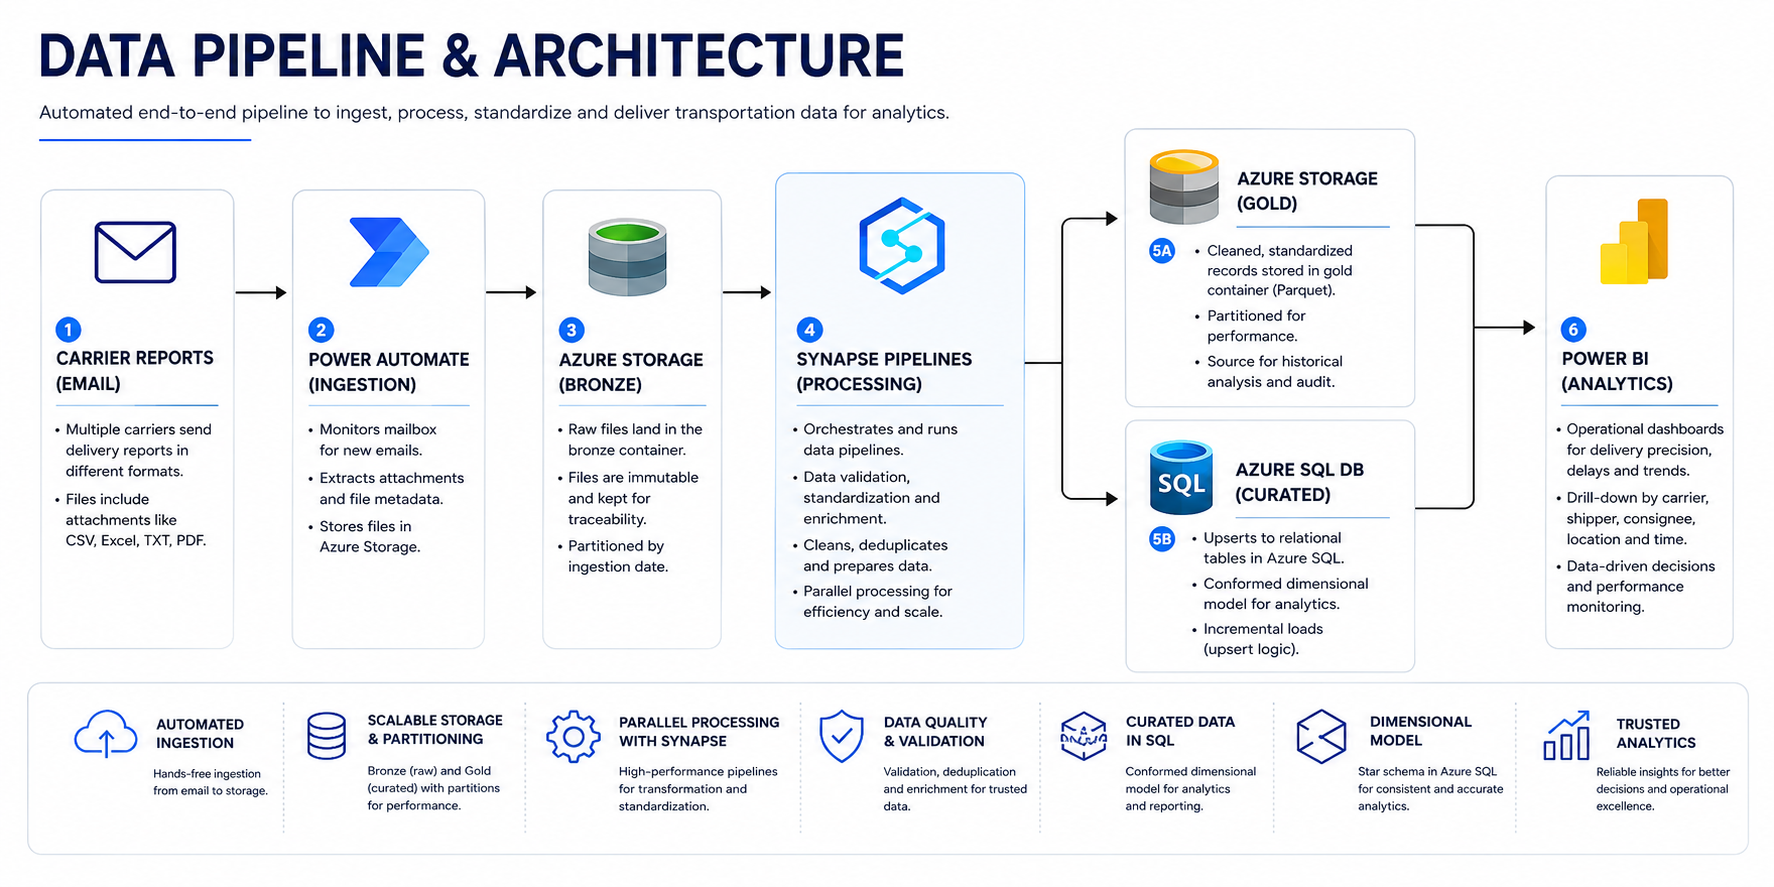
Carrier attachments move through an automated ingestion and processing flow. Raw files remain available in the Bronze layer, while Synapse pipelines validate, clean and standardize the data before publishing trusted outputs to Gold storage and curated Azure SQL tables.
Hands-free file intake
Power Automate watches incoming carrier reports, captures attachments and preserves the original files in Azure Storage for traceability.
Standardize once
Synapse pipelines orchestrate validation, cleansing, deduplication and carrier-specific transformation logic before records move downstream.
Two trusted outputs
Clean records are retained in the Gold container for history and audit while curated dimensional tables are incrementally upserted in Azure SQL for analytics.
Different carriers in. One shipment model out.
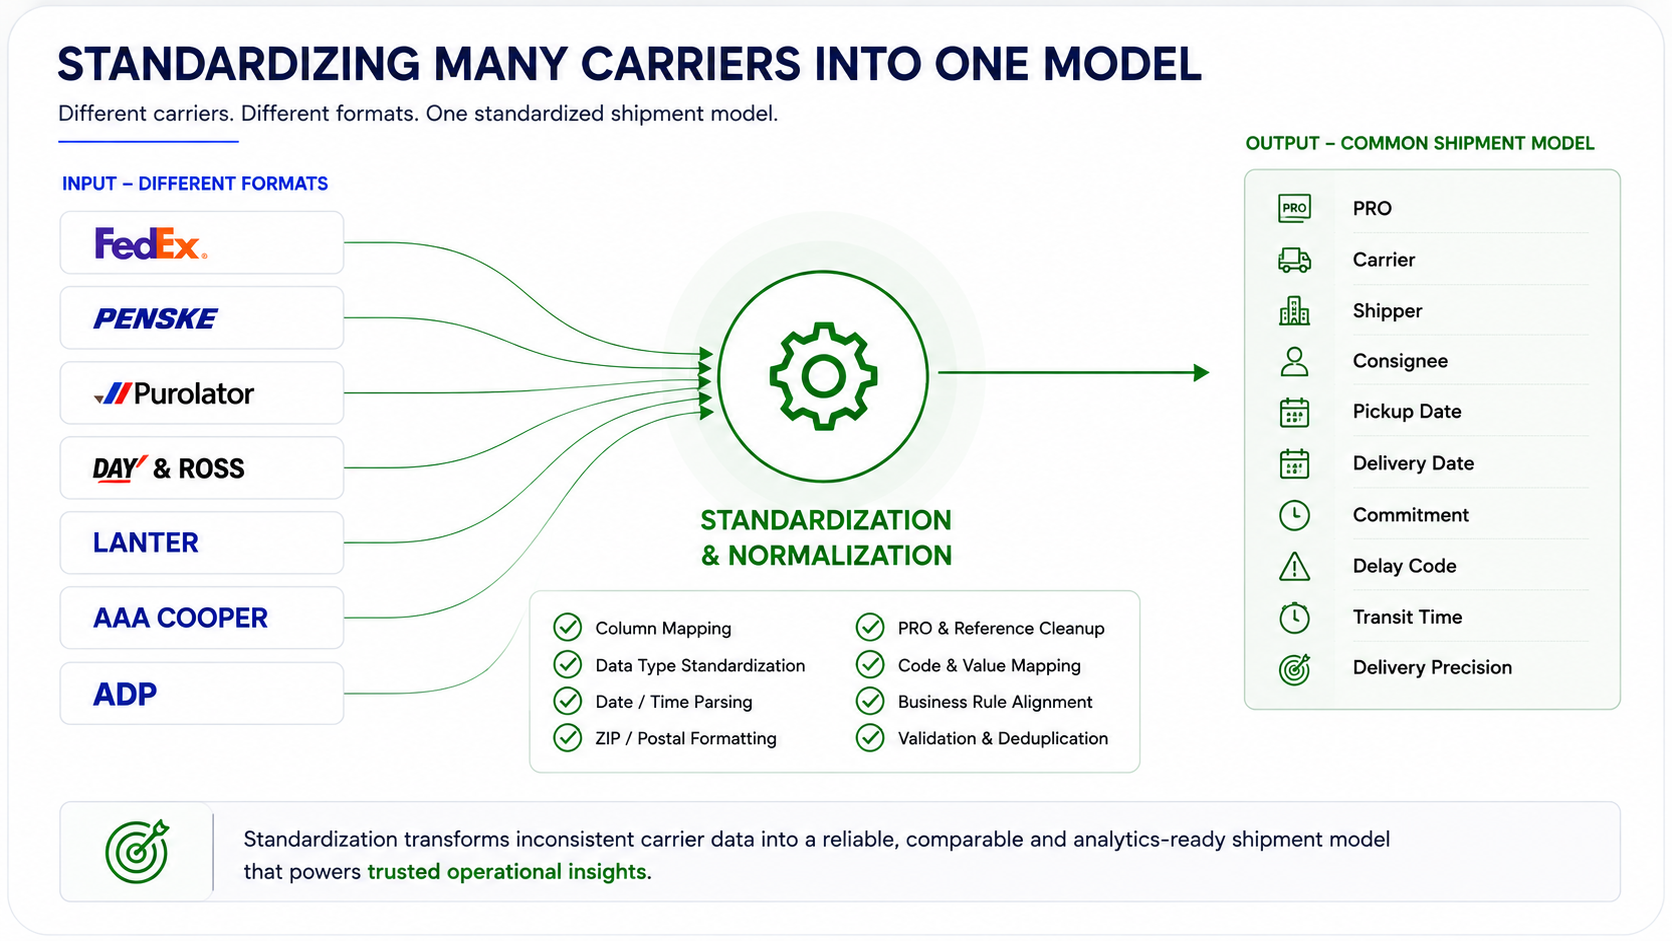
The transformation layer converts carrier-specific reports into a canonical shipment structure. Mapping, type normalization, date and time parsing, reference cleanup, code mapping, business rules, validation and deduplication all happen before analytics sees the data.
Carrier complexity stops here.
A downstream report should not need to know whether a source called a field PRO, shipment number, tracking number or something else. That interpretation belongs in one controlled transformation layer.
A model designed around delivery precision.
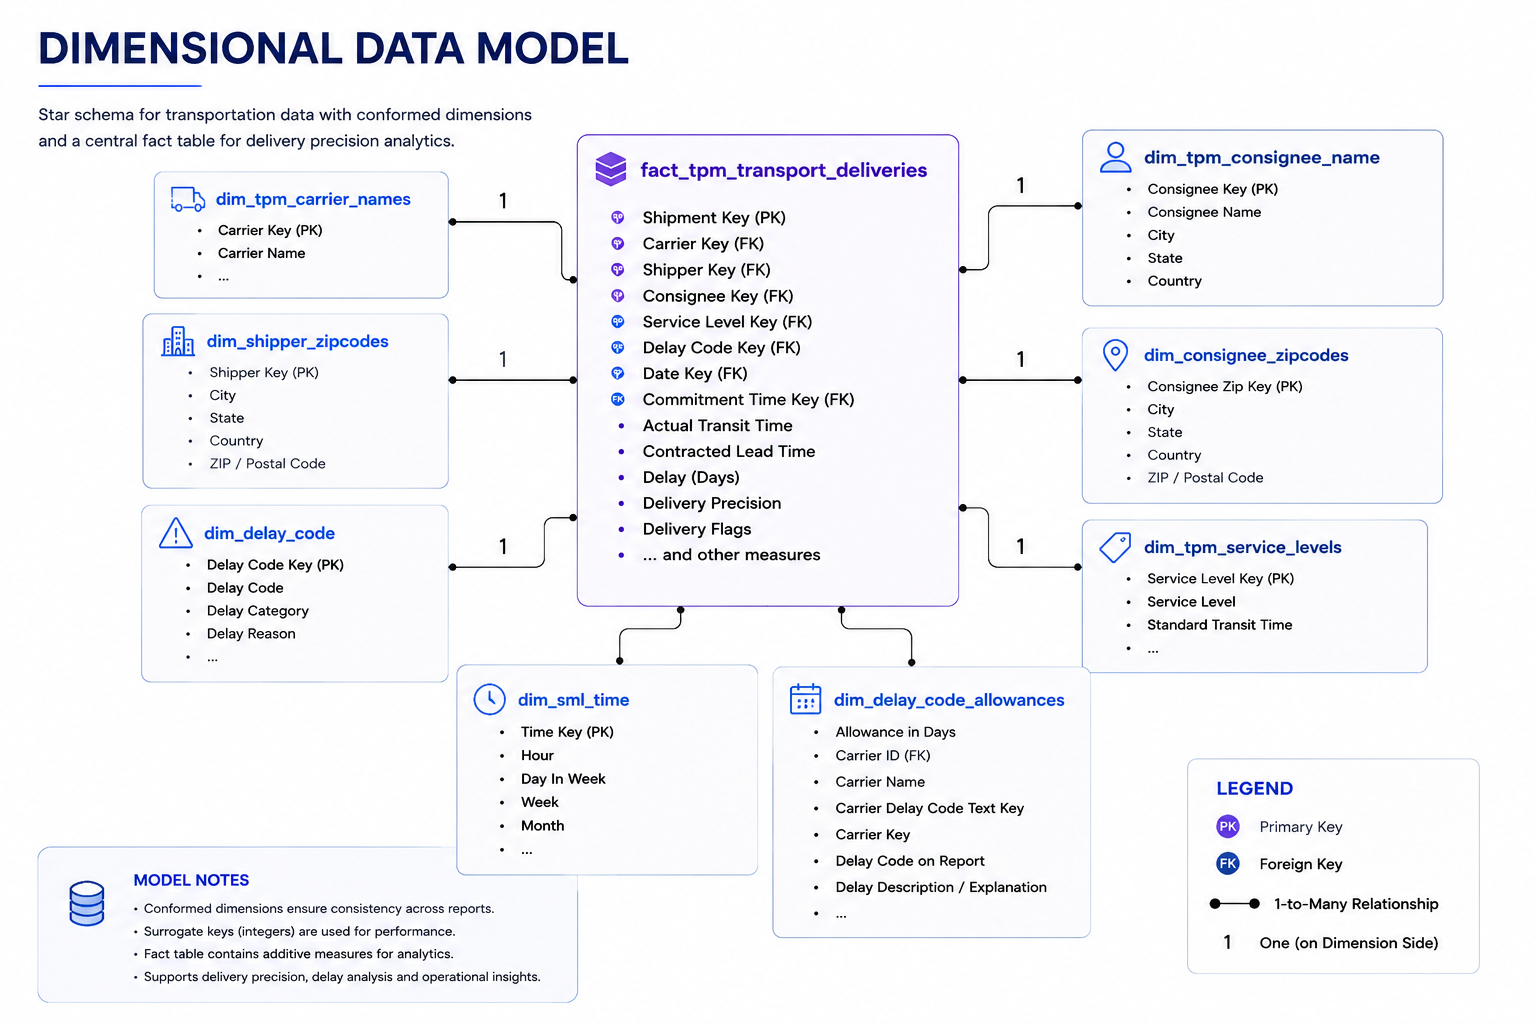
After standardization, shipment events are loaded into a central transport fact table with conformed carrier, shipper, consignee, service-level, delay-code and time dimensions. This separates reusable business context from transaction-level measures and keeps reporting consistent.
Shipment-level measures
The fact table holds the analytical grain: shipment keys, transit time, contracted lead time, delay days, delivery precision and operational flags.
Reusable business context
Carrier, shipper, consignee, location, service-level and time dimensions keep descriptive attributes consistent across every report.
Performance logic stays governed
Delay allowances and carrier-specific rules are modeled centrally so the same shipment produces the same delivery-precision result everywhere.
Analytics starts with a governed definition of “on time.”
Delivery precision is not simply actual date versus planned date. The platform evaluates commitment time, contracted transit time, carrier-specific delay allowances and approved exception codes before assigning the final delivery status.
Determine the applicable promised delivery date and time.
Use carrier and service-level transit expectations.
Interpret standardized delay codes and approved allowances.
Expose one governed status for dashboards and analysis.
The data model becomes an operating view of transportation performance.
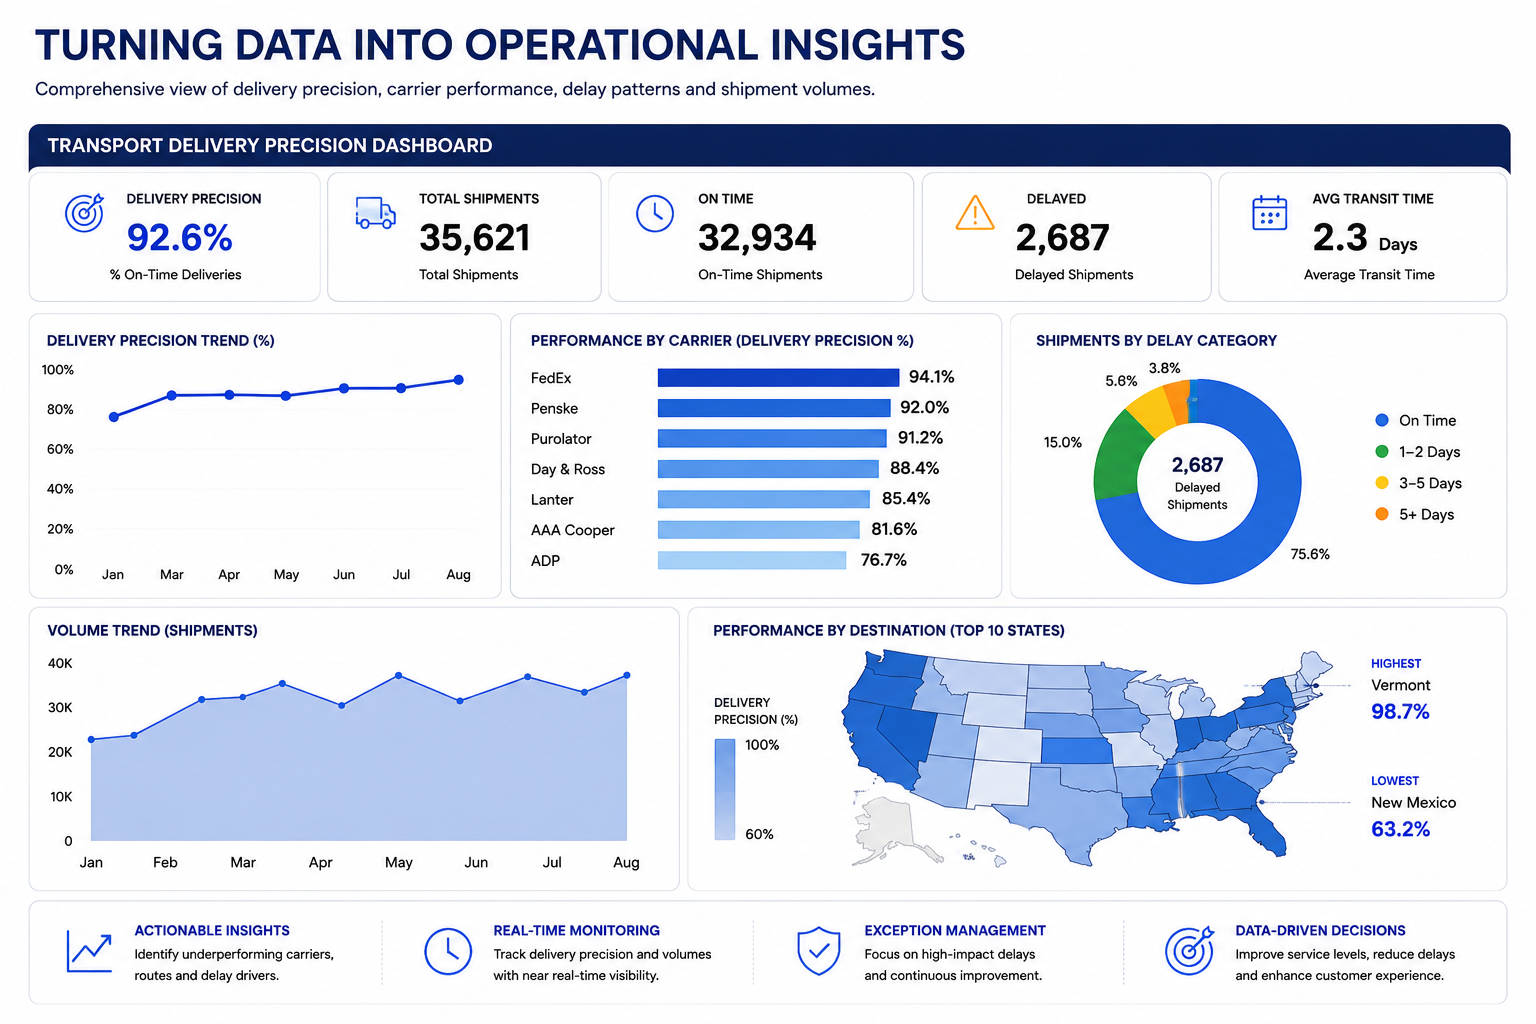
Power BI converts the trusted model into carrier scorecards, shipment trends, delay-category analysis, geographic performance and operational exception views. The goal is not another dashboard—it is a faster path from shipment behavior to action.
From data movement to operational decisions.
One trusted transportation story—from source file to decision.
The platform turns fragmented carrier reporting into a governed, reusable data product: traceable ingestion, standardized records, a curated dimensional model and a consistent delivery-precision layer for operational analytics.